The Squeeze Is One Bollinger Bands Strategy You Need to Know
Today I’m going to discuss a great Bollinger Bands Strategy. Over the years I’ve seen many trading strategies come and go.
What typically happens is a trading strategy works well on specific market conditions and becomes very popular.
Once the market conditions change, the strategy no longer works and is quickly replaced with another strategy that works in the current market conditions.
When John Bollinger introduced the Bollinger Bands Strategy over 20 years ago I was skeptical about its longevity.
I thought it would last a short time and would fade into the sunset like most popular trading strategies of the time. I have to admit that I was wrong and Bollinger Bands became one of the most relied on technical indicators that was ever created
What Are Bollinger Bands
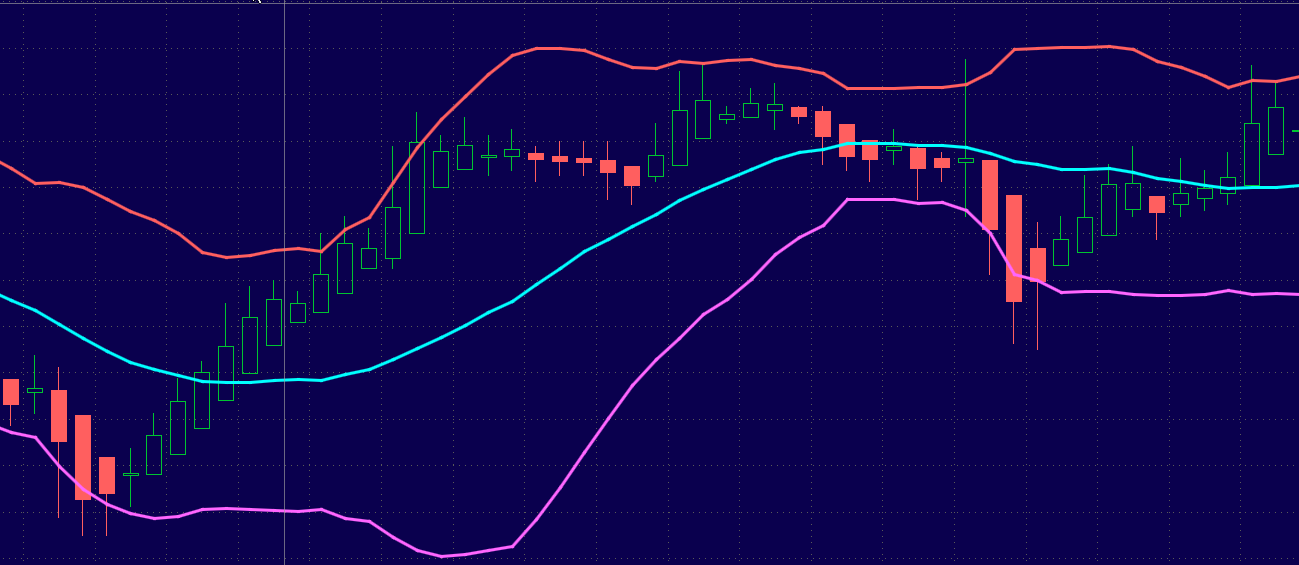
For those of you who are not familiar with Bollinger Bands it’s rather a simple indicator. You begin with the 20-day Simple Moving Average of the closing prices.
The upper and lower bands are then set two standard deviations above and below this moving average. The bands move away from the moving average when volatility expands and move towards the moving average when volatility contracts.
Many traders length of the moving average depending on the time frame they use. For today’s demonstration we will rely on the standard settings to keep things simple.
Notice in this example how the bands expand and contract depending on the volatility and the trading range of the market. Notice how the bands dynamically narrow and widen based on the day to day price action changes.

The Bands Contract and Expand Based on Daily Changes in Volatility
Is this simple 4 letter code the secret great trades in 72 hours?
This string of code could be very productive in just 72 hours. Really. This code has spit out 321 winning trades out of 324 tries in the past three years. That’s a 99.1% success rate.
Click here right now to see the INSANE details.
The Bollinger Band-Width
There’s one additional indicator that works hand in hand with Bollinger Bands that many traders do not know about.
It’s actually part of Bollinger Bands but since the Bollinger Bands are always drawn on the chart instead of below the chart there is no logical place to put this indicator when rendering the formula for the actual bands.
The indicator is called Band-Width and the sole purpose of this indicator is to subtract the lower band value from the upper band.
Notice in this example how the Band-Width indicator gives lower readings when the bands are contracting and higher readings when bands are expanding.

The Band-Width Is Part Of The Bollinger Band Indicator
One Bollinger Bands Strategy Got My Attention
I’ve used the Bollinger Bands many different ways over the years with positive results. One particular Bollinger Bands Strategy that I use when volatility is decreasing in the markets is the Squeeze entry strategy. It’s a very simple strategy and works very well for stocks, futures, foreign currencies and commodity contracts.
The Squeeze strategy is based on the idea that once volatility decreases for extended periods of time the opposite reaction typically occurs and volatility expands greatly once again.
When volatility expands markets usually begin trending strongly in one direction for a short period of time.
The Squeeze begins with the Band-Width making a 6 month low. It doesn’t matter what the actual number is because it’s relative only to the market you are looking to trade and nothing else.
In this example you can see IBM stock reaching the lowest level of volatility in 6 months. Notice how the price of the stock is barely moving at the time the 6 month Band-Width Low Is Reached. This is the time to begin looking at markets because 6 month low Band-Width levels typically precede strong directional moves.

Notice The Tight Trading Range at The Time The Signal Is Generated
In this example you can see how IBM stock breaks outside of the upper Bollinger Band immediately after the stocks Band-Width level reached 6 month low.
This is a very common occurrence and one you should begin watching out for on a daily basis. The 6 month Band-Width low is a great indicator that precedes strong directional momentum.

Breakout Outside Of The Upper Band Occurs Right After The Volatility Reaches 6 Month Low
Another Example
In this example you can see how Apple Computers reaches the lowest Band-Width level in 6 months and one day later the stock breaks outside of the upper band. This is the type of set ups you want to monitor on a daily basis when using the Band-Width indicator for Squeeze set ups.

Apple Reaches Lowest Band-Width Reading In 6 Months
Notice how the Band-Width begins to increase quickly after reaching the 6 month low level. The price of the stock will usually begin moving higher within a few days of the 6 month Band-Width low.

Volatility And Momentum Begin To Rise After The 6 Month Band-Width Low
Things To Keep in Mind
The Squeeze is one of the simplest and most effective methods for gauging market volatility, expansion and contraction.
Always remember that markets go through different cycles and once volatility decreases to a 6-month low, a reversion usually occurs and volatility begins to go up once again.
When volatility begins to increase prices usually begin moving in one direction for a short period of time.