
No one ever said trading was easy. If it was, everyone would be doing it.
If you’re just starting out, there’s a simple way to spot exact entry and exit points. All we have to do is paying attention to the herd by way of technical analysis.
To do so, we rely on four technical pivot points, including Bollinger Bands, relative strength (RSI), and Williams’ %R (W%R). The trick being that all of these indicators must align before you pull the trigger to buy or sell a stock.
While that may sound complicated, it’s not. In fact, it’s very easy once you get the hang of it.
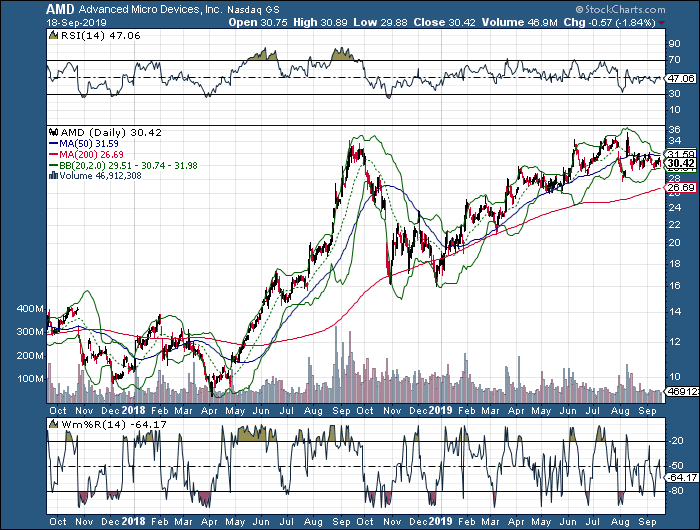
Let’s break down each of those technical indicators using Advanced Micro Devices (AMD).
Grab this report and receive two strategies that explain how you can use options to substantially increase your trading consistency while dramatically managing your risk.
Grab Your FREE Report Right Here!
Indicator No. 1—Bollinger Bands
On this chart of AMD, the Bollinger Bands surround the stock (the green lines). Notice what happens when AMD hits or attempts to penetrate the lower green line. Shortly after, it bounces. Or, look at what happens when AMD hits or even attempts to break above the upper green line.
It falls apart and pivots lower.
However, we can’t just rely on a single indicator as our buy or sell signal.
Indicator No. 2 – Relative Strength (RSI)
When RSI drops or below its 30-line, the stock is considered oversold. Now, when this happens, and the stock is at its lower Bollinger Band, it tells us the stock may be down too far, too fast. Or, look at what happens when RSI is at or above its 70-line, and the stock is at its upper Bollinger Band. That tells us the stock may be up too far, too fast.
Then again, we don’t want to just rely on two indicators, so we begin to also look at W%R.
Indicator No. 3 – Williams’ %R (W%R)
What’s nice about W%R is that it turns higher or lower before the stock does. It’s the crystal ball of stocks, if you will. When it runs to or above its 80-line, the stock is considered oversold. If, at the same time, the stock is also at its lower Bollinger Band, and RSI is below 30, it’s a strong entry signal. Reverse those and you have a powerful exit signal.
Look, trading isn’t easy. But these three indicators can tell you exactly when to buy or sell.