Dow Skyrockets to Best Its Month Since 1976. What’s Next?
wlthempire | October 31, 2022
October 2022 was the largest single monthly increase in the Dow Jones Industrial Average since 1976. It’s been 46 years since the Dow has seen that kind of monthly run. I was a carefree Junior in high school when that happened.
After a painful year of market performance, fueled by Russia’s invasion of Ukraine, rising inflation, supply chain issues and a pandemic hangover, the markets started reversing back to the upside.
It wasn’t just the Dow that enjoyed success. The Russell 2000, which follows 2000 small-cap and mid-cap stocks also roared, gaining over 11% on the month. The Russell 2000 is thought by some experts to be one of the best barometers of economic health because it is a better representation of corporations across the board and is not just a representation of a handful of industry giants. The S&P 500 notched an 8.9% gain and the tech-heavy Nasdaq lagged with a 5.2% gain (source: Investing.com).
The runup in the markets was welcome after 3 quarters of steady declines. All markets are still down on the year, so what’s next for the Dow?
From a technical perspective, let’s take a look at the daily chart first.
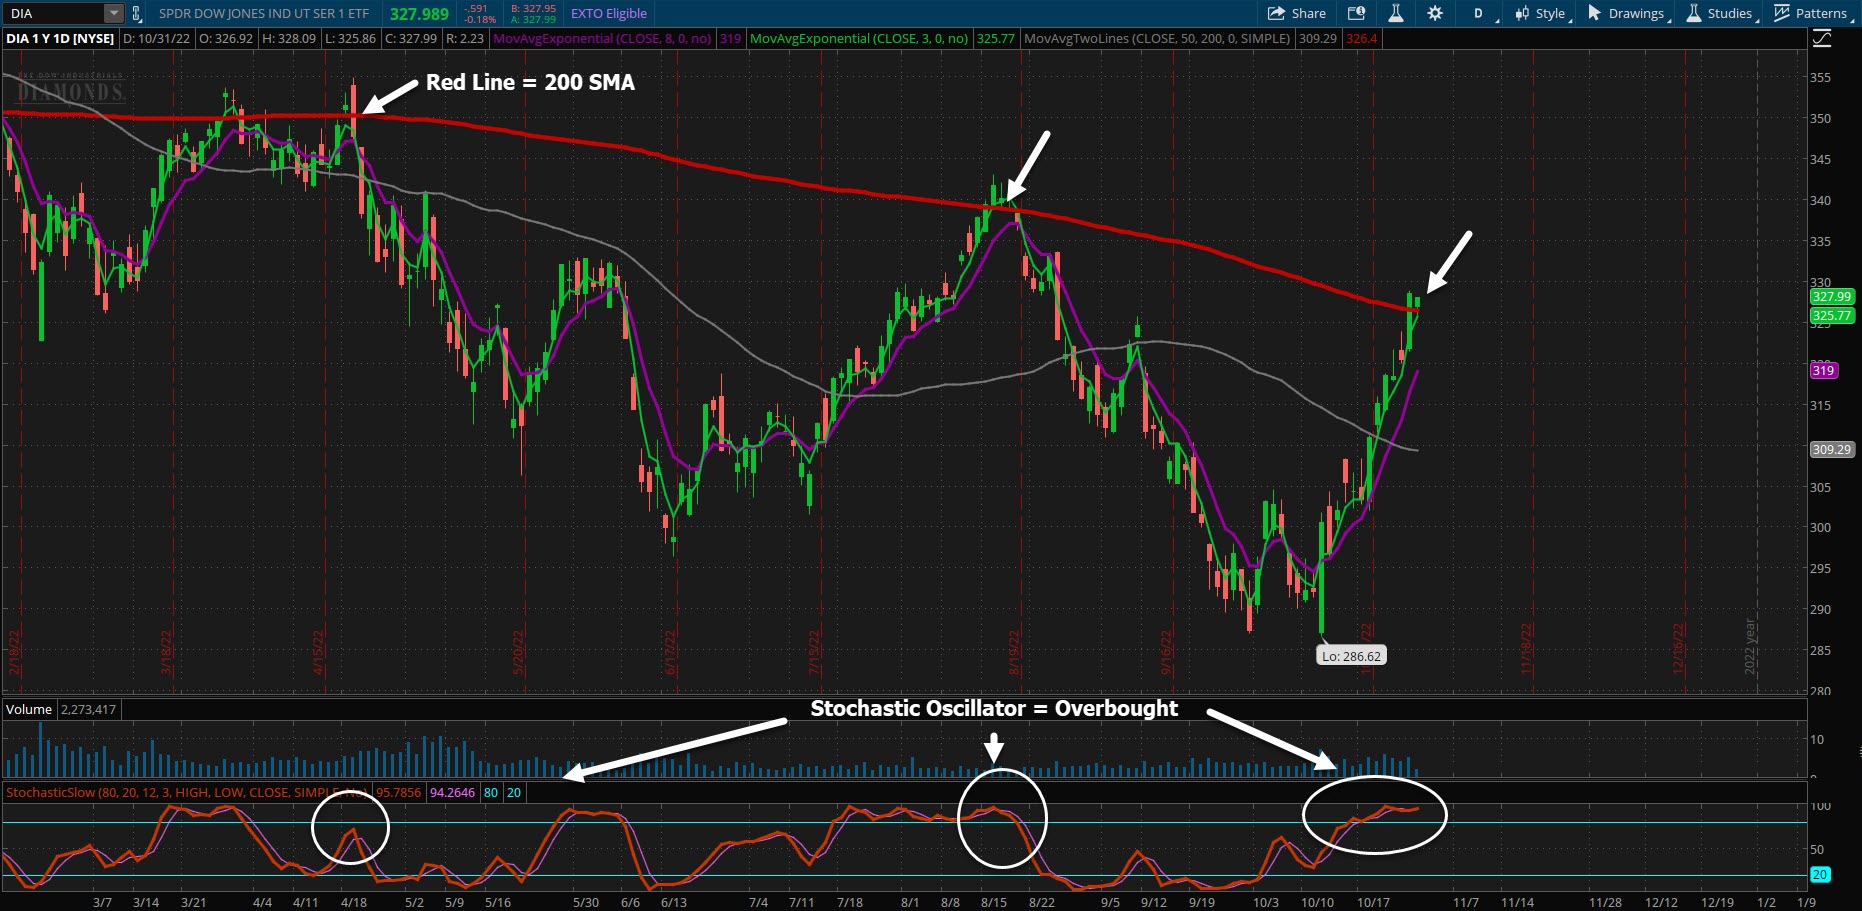
This is a Daily Chart, where each candlestick represents one day of trading activity. The thick red line is the 200 Simple Moving Average, which reflects the average price of a financial instrument over the past 200 days, or 40 weeks. It can be a very powerful indicator for support or resistance.
Watch what happens when price toughes the 200 SMA. In recent months, the 200 SMA has held solidly as resistance, and price moved back down. Notice that the stochastic oscillator on the bottom of the chart was at or above the 80 line, suggesting that the market was very overbought, and it was time for a cooling off period.
Will the markets cool off in November?
Anything is possible, but there are multiple reasons why this could happen:
The Fed will be announcing a probable .75 point rate hike in November, followed by a possible .50 point rate hike in December to tamp down inflation. While these expectations are priced into the markets, any deviation in Fed policy could send shock waves through the markets.
The RSI and many other oscillators are showing the markets to be extremely overbought on the daily charts.
The Bond markets have been fueling the markets but are showing signs of cooling off.
In the short term, a correction or pullback could happen, as has been demonstrated in the past. But what about the medium to long term? Let’s switch to the monthly charts, where each bar represents one month of trading activity.
This is all about perspective. The monthly charts give you a mile-high view of the markets over time. From this view, the 50 SMA, which measures the average price over the past 50 months, has held up strongly as support. If you have a picture, or longer-term horizon, this chart shows how resilient markets can be over time.
Notice how the October 2022 candle is the biggest candle on the chart, challenged only by April 2022, when it looked like we would finally get through Covid.
Things to Keep in Mind
The purpose of this article is to provide a perspective to what has been happening in the markets. Past performance certainly doesn’t guarantee future results. These are uncertain and sometimes scary times we are living in. Any major geopolitical event could jolt the markets. In the long run, markets have always proven to be resilient. In the meantime, trade wisely.
Monday Closing Bell, October 31 (4 PM ET)
DJIA
32,724.91 -136.89 (-0.42%)
S&P 500
3,872.25 -28.81 (-0.74%)
NASDAQ
10,792.67 -114.31 (-1.03%)
Russell 2000
1853.33 +6.43 (+0.54%)
Crude Oil
86.03 -1.87 (-2.13%)
US Dollar Index
111.448 +0.849 (+0.77%)
We use cookies on our website to give you the most relevant experience by remembering your preferences and repeat visits. By clicking “Accept All”, you consent to the use of ALL the cookies. However, you may visit "Cookie Settings" to provide a controlled consent.
This website uses cookies to improve your experience while you navigate through the website. Out of these, the cookies that are categorized as necessary are stored on your browser as they are essential for the working of basic functionalities of the website. We also use third-party cookies that help us analyze and understand how you use this website. These cookies will be stored in your browser only with your consent. You also have the option to opt-out of these cookies. But opting out of some of these cookies may affect your browsing experience.
Necessary cookies are absolutely essential for the website to function properly. These cookies ensure basic functionalities and security features of the website, anonymously.
Cookie
Duration
Description
cookielawinfo-checkbox-analytics
11 months
This cookie is set by GDPR Cookie Consent plugin. The cookie is used to store the user consent for the cookies in the category "Analytics".
cookielawinfo-checkbox-functional
11 months
The cookie is set by GDPR cookie consent to record the user consent for the cookies in the category "Functional".
cookielawinfo-checkbox-necessary
11 months
This cookie is set by GDPR Cookie Consent plugin. The cookies is used to store the user consent for the cookies in the category "Necessary".
cookielawinfo-checkbox-others
11 months
This cookie is set by GDPR Cookie Consent plugin. The cookie is used to store the user consent for the cookies in the category "Other.
cookielawinfo-checkbox-performance
11 months
This cookie is set by GDPR Cookie Consent plugin. The cookie is used to store the user consent for the cookies in the category "Performance".
viewed_cookie_policy
11 months
The cookie is set by the GDPR Cookie Consent plugin and is used to store whether or not user has consented to the use of cookies. It does not store any personal data.
Functional cookies help to perform certain functionalities like sharing the content of the website on social media platforms, collect feedbacks, and other third-party features.
Performance cookies are used to understand and analyze the key performance indexes of the website which helps in delivering a better user experience for the visitors.
Analytical cookies are used to understand how visitors interact with the website. These cookies help provide information on metrics the number of visitors, bounce rate, traffic source, etc.
Advertisement cookies are used to provide visitors with relevant ads and marketing campaigns. These cookies track visitors across websites and collect information to provide customized ads.

 This is a Daily Chart, where each candlestick represents one day of trading activity. The thick red line is the 200 Simple Moving Average, which reflects the average price of a financial instrument over the past 200 days, or 40 weeks. It can be a very powerful indicator for support or resistance.
Watch what happens when price toughes the 200 SMA. In recent months, the 200 SMA has held solidly as resistance, and price moved back down. Notice that the stochastic oscillator on the bottom of the chart was at or above the 80 line, suggesting that the market was very overbought, and it was time for a cooling off period.
Will the markets cool off in November?
Anything is possible, but there are multiple reasons why this could happen:
This is a Daily Chart, where each candlestick represents one day of trading activity. The thick red line is the 200 Simple Moving Average, which reflects the average price of a financial instrument over the past 200 days, or 40 weeks. It can be a very powerful indicator for support or resistance.
Watch what happens when price toughes the 200 SMA. In recent months, the 200 SMA has held solidly as resistance, and price moved back down. Notice that the stochastic oscillator on the bottom of the chart was at or above the 80 line, suggesting that the market was very overbought, and it was time for a cooling off period.
Will the markets cool off in November?
Anything is possible, but there are multiple reasons why this could happen:
 This is all about perspective. The monthly charts give you a mile-high view of the markets over time. From this view, the 50 SMA, which measures the average price over the past 50 months, has held up strongly as support. If you have a picture, or longer-term horizon, this chart shows how resilient markets can be over time.
Notice how the October 2022 candle is the biggest candle on the chart, challenged only by April 2022, when it looked like we would finally get through Covid.
This is all about perspective. The monthly charts give you a mile-high view of the markets over time. From this view, the 50 SMA, which measures the average price over the past 50 months, has held up strongly as support. If you have a picture, or longer-term horizon, this chart shows how resilient markets can be over time.
Notice how the October 2022 candle is the biggest candle on the chart, challenged only by April 2022, when it looked like we would finally get through Covid.